Why generative models cannot be evaluated like discriminative models
Usually, we train a deep learning model on training data and then evaluate it on test data. However, for generative models, we cannot directly compare the generated samples to the test data in the same way we evaluate discriminative models. This is because:
- Generative models produce new, unique samples rather than predictions on existing data.
- There’s no one-to-one correspondence between generated samples and real data points.
- We need to assess the quality, diversity, and realism of the generated samples, which requires different metrics.
- Traditional evaluation metrics like accuracy or mean squared error are not applicable to generative tasks.
Therefore, we need specialized methods to evaluate generative models, such as the Frechet Inception Distance (FID), which measures the similarity between the distribution of generated samples and the distribution of real data.
What is FID?
Frechet Inception Distance (FID) is a metric used to assess the quality of images generated by generative models, such as GANs (Generative Adversarial Networks). It measures how similar the generated images are to real images in terms of their statistical properties.
How to calculate FID:
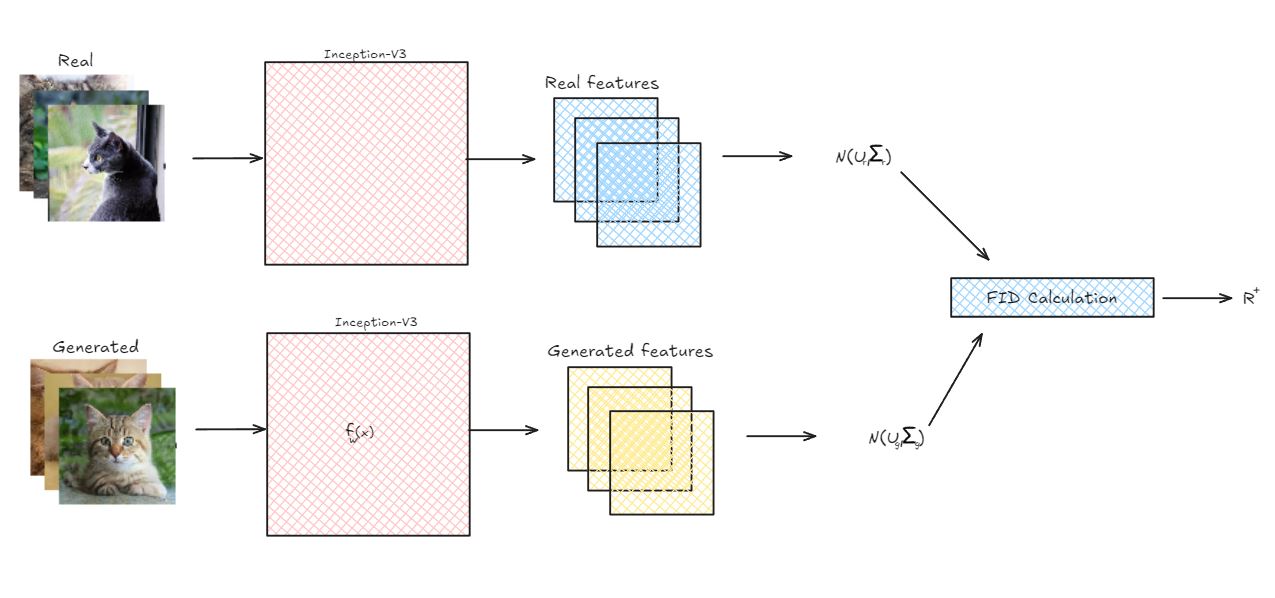
Feature Extraction: FID uses a pre-trained Inception v3 network to extract features from both real and generated images. This network captures high-level representations of the images.
Distribution Comparison: It assumes that the feature vectors for both real and generated images follow a multidimensional Gaussian distribution.
Statistical Moments: FID calculates the mean and covariance of the feature distributions for both real and generated images. These statistical moments capture the overall characteristics of the image distributions.
Distance Calculation: The Frechet distance between these two Gaussian distributions is then computed. This distance is defined as:
$$FID = \|\mu_r - \mu_g\|^2 + \operatorname{Tr}(\Sigma_r + \Sigma_g - 2\sqrt{\Sigma_r \cdot \Sigma_g})$$Where:
- $\mu_r$ and $\mu_g$ are the mean feature vectors for real and generated images
- $\Sigma_r$ and $\Sigma_g$ are the covariance matrices for real and generated images
Interpretation: A lower FID score indicates that the generated images are more similar to the real images. A score of 0 would mean the two distributions are identical.
Advantages:
- Considers both quality and diversity of generated images
- Correlates well with human judgment of image quality
- More robust than other metrics like Inception Score
Limitations:
- Depends on the choice of the feature extractor (Inception v3)
- May not capture all aspects of image quality or diversity
- Computationally expensive for large datasets
FID has become a standard evaluation metric in the field of generative models, particularly for image generation tasks, due to its ability to provide a meaningful measure of the similarity between generated and real image distributions.